cross-posted from the Journal of the Agricultural and Applied Economics Association
Abstract
Producer organizations (POs) receive substantial attention and policy support, given their potential to contribute to pro-poor rural development. Here, we first synthesize decades of empirical research in the form of five stylized facts—common and largely unchallenged conclusions—about POs. Then, we explore these stylized facts using several secondary and primary data sets. We confirm some stylized facts, challenge others, and highlight which ones lack empirical evidence to derive policy implications and directions for future research. We highlight largely overlooked low and regionally biased participation rates and suggest that future research should pay more attention to the diverse forms and characteristics of POs.
1 INTRODUCTION
Producer organizations (POs)—that is, member-based organizations of different organizational forms such as cooperatives, associations, and more-informal groups—are commonly seen as pro-poor institutions that can play a key role in promoting the sustainable development goals (SDGs) in rural areas. For instance, they can reduce transaction costs facing individual farmers and their partners, facilitate market access, and the implementation of development projects. Over the last decades, the international development community as well as many lower-income countries' governments have dedicated substantial resources to support the formation and improvement of POs. Yet POs also involve important challenges such as elite capture, free-rider problems, lack of management and leadership skills, and limited financial sustainability without external support.
The literature on POs is large and increasing. However, there are at least three important shortcomings in the extant literature. First, most available studies focus on the household level and often overlook intra-household and regional patterns of participation. Second, virtually all available studies (with few notable exceptions), focus on purposefully selected case studies. Third and relatedly, most papers use samples including one or a handful of organizations, and even studies that include a larger number of organizations often pay little attention to organizational characteristics, with only a few exceptions. Given these prevalent research designs, it is not clear whether the conclusions of the available studies are generalizable to other organizations or locations.
Here, we contribute to a better understanding of the opportunities, challenges, and limitations facing POs, their members, and their supporters. We first conduct a comprehensive narrative literature review to highlight and discuss key findings from the large body of literature on POs, and community-driven development. We highlight five recurrent findings and largely unchallenged conclusions—stylized facts—about POs and rural development, namely:
1. Marginalized farmers tend to be excluded from POs,
2. POs help mitigate policy and market failures by facilitating access to inputs, services, and markets,
3. Members of POs benefit from their membership,
4. Organizational characteristics differ and matter,
5. POs benefit communities at large.
These stylized facts reflect core and recurrent parts of the discourse on POs both in the academic literature and policy debate. Here, we summarize these stylized facts and empirically challenge them using a wide range of nationally representative secondary data and unique primary data sets. Thereby, we address three shortcomings in the literature on POs. First, our data allow us to consider four different levels, namely individual, household, PO, and community levels. Second, we use nationally representative data sets from 10 countries, thereby increasing external validity. Third, using unique primary data sets, we explore the importance of organizational characteristics, related challenges, and implications for members. While the empirical exploration is predominantly descriptive and, thus, does not reveal causal relationships, it highlights key issues that were impossible to explore and demonstrate with the previously used (case-study-based) data. Our results also highlight important areas for future research, both in terms of topics and in terms of methodological challenges.
2 MATERIALS AND METHODS
This paper offers a narrative review of the literature on POs in the form of the five stylized facts. The selected stylized facts reflect important and policy-relevant opportunities, challenges, and limitations facing POs, their members, and their supporters. The goal of this paper is not to provide an exhaustive or systematic review of the literature on POs, as done elsewhere. Instead, we concentrate on the aforementioned five stylized facts, which were selected because they are recurrent and prominent in the extant literature and because we can add interesting and novel insights with the data at hand. In particular, we use different primary and secondary data sets, which are summarized below and in Supporting Information: Tables S1–S3. These data cover different levels, namely the individual (individuals within a household), household, community, and PO levels. Primary data come from Cote d'Ivoire, Ethiopia, and Kenya and capture the household and PO levels. Secondary data are nationally representative, publicly available, and come from the (i) Consultative Group to Assist the Poor (CGAP) smallholder surveys, which cover the individual level in Bangladesh, Cote d'Ivoire, Mozambique, Nigeria, Tanzania, and Uganda; (ii) Living Standards Measurement Study-Integrated Surveys on Agriculture (LSMS-ISA), from which we use data from the community-level questionnaires in Malawi, Mali, Niger, Nigeria, Tanzania, and Uganda; and (iii) Peruvian National Agricultural Survey, which covers the household level.
CGAP smallholder surveys
CGAP is a think-thank that conducted smallholder surveys in the years 2015 and 2016 in six countries, namely Bangladesh, Cote d'Ivoire, Mozambique, Nigeria, Tanzania, and Uganda. Data were collected using a multistage sampling frame and are nationally representative of smallholder farmers in the six aforementioned countries.
Data were collected at the household and individual levels using three different questionnaires (i.e., the household-level questionnaire, the multiple-response questionnaire, and the individual response questionnaire). We use data from the individual response questionnaire which was conducted with one randomly selected household member above the age of 15 who contributes to household income (per default, thus, often the household head). It includes information on membership in POs and access to services accessed from POs. Here, POs include production groups, export groups, processing groups, cooperatives, and farm implement groups.
LSMS-ISA
LSMS-ISA are conducted by the World Bank in collaboration with national statistical institutions in eight African countries, namely Burkina Faso, Ethiopia, Malawi, Mali, Niger, Nigeria, Tanzania, and Uganda. Data are publicly available (microdata.worldbank.org), nationally representative, and cover several years (with variation across countries). Interviews were conducted at the household and community levels. Here, we use the community-level data as the household questionnaire does not include questions on household-level participation in POs. The community survey is conducted with local leaders and covers, among many other issues, information on POs that operate in the community. We exclude Burkina Faso and Ethiopia as the community questionnaire does not include questions on POs. POs refer to cooperatives (Malawi, Mali, Niger, and Tanzania), cooperatives/farmer-based organizations (Nigeria), and cooperatives, farmer groups, and livestock associations (Uganda).
Peruvian national agricultural survey
The Peruvian Statistical Institute (Instituto Nacional de Estadística e Informática [INEI]) provides data from its National Agricultural Survey (Encuesta National Agropecuaria) online (inei.gob.pe). Data are nationally representative of Peru and repeated cross-section, covering the timeframe 2014–2018. Each year, about 26,000 farms were interviewed, including both small and medium-sized farms (smaller than 50 hectares) and large, agro-industrial producers. The questionnaire for agro-industrial producers does not include questions on membership in POs (in this context cooperatives), presuming because agro-industrial producers in Peru are unlikely to be members of POs. Thus, given the lack of data, we restrict the sample to small and medium-sized farms.
PO and household surveys in Cote d'Ivoire
The research project was run by the University of Goettingen in collaboration with the World Agroforestry Center (ICRAF) to explore the effects of Fairtrade certification on farmers and farm workers. The survey was conducted in the year 2018 in the Western part of Cote d'Ivoire. The sample includes 50 cocoa POs (cooperatives) and their members (10 cocoa producers from each of the 50 POs). POs were randomly selected from a complete list of all POs in the Western part of Cote d'Ivoire. Interviews were conducted with the leaders of each organization and covered questions on the characteristics of the organizations, leaders, and members.
Members were randomly selected based on complete membership lists. The interviews were conducted with household heads (typically men) who hold major responsibilities in cocoa production, and questions covered various household, farm, and contextual characteristics. All sampled households are members of POs.
PO and household surveys in Ethiopia
The research project was run by the University of Copenhagen in collaboration with the Oromia Forest and Wildlife Enterprise (OFWE) and Environment and Climate Research Center (ECRC) at the Ethiopian Policy Studies Institute (PSI) to better understand the factors determining successful participatory forest management. The survey was conducted in 2017 in Ethiopia's Oromia Region. POs in this context are farmers organized in forest user groups that participate in a large-scale participatory forest management program that was initiated by the Ethiopian Government in collaboration with the German Development Agency (GIZ). A total of 132 POs and 1222 randomly selected members, leaders, and vice-leaders of these organizations were sampled. Interviews were conducted with household heads. In addition, administrative data on the organizational characteristics were obtained from OFWE.
PO and household surveys in Kenya
The research project was initiated by the University of Goettingen in collaboration with local partners (Africa Harvest, a local NGO) to explore nutrition-sensitive approaches to agricultural development. For this purpose, data were collected in 2015 in two counties (Kisii and Nyamira) in Western Kenya.
Data were collected at two levels, namely PO and member (farmer) levels. POs in this context are extension and saving groups, which were founded by governmental actors or by farmers themselves. For the survey, 48 POs were randomly selected from all 107 POs that exist in the two counties. About 17 farmers were randomly sampled from each organization's membership lists for the household survey (N = 815). PO leaders answered the PO questionnaires, which include detailed information on organizational, member, and leader characteristics.
Methods
Our results are based on descriptive statistics, correlations, and ordinary least square (OLS) regressions and do not imply causal relations. In what follows, we briefly describe the regression framework to explore correlates of participation, the relationship between participation and income, and group heterogeneity.
To explore which variables are associated with participation at the individual and household levels, we use CGAP and Peru data, respectively, and linear probability models, which yield similar results to Probit models (see Supporting Information: Tables S14–S15 for the Probit results). At the individual level, the outcome variable (Y) is a dummy variable indicating whether individual i is a member of a PO. Variables of interest (x) are individual- and household-level characteristics. The regression includes country-fixed effects. Similarly, at the household level (Peru data), the outcome variable (Y) is a dummy indicating whether household i is a member of a PO. All regressions include administrative level and year fixed effects.
To estimate the relationship between membership and farm income, we use data from Peru and regress the log of annual farm income on a binary variable indicating whether the household is a member of a PO and on a vector of household characteristics. All regressions include year fixed effects and administrative-level fixed effects. All of this is the exception in this body of literature, which mainly draws on cross-sectional data and does not control for geographical differences and time-invariant unobserved heterogeneity.
Similarly, to explore the relationship between PO characteristics and members' annual agricultural income we use our primary data from Cote d'Ivoire, Ethiopia, and Kenia. We run pooled OLS regression where the logarithm of annual farm income is regressed on a vector of PO and household characteristics (averages among members). All regressions include country fixed effects.
Lastly, to explore the heterogeneity in PO characteristics, we use principal component analysis (PCA). For this purpose, we first standardized all variables to unit variance. The results of the PCA are summarized in a circle of correlations (Supporting Information: Figure S2) and a score plot of individuals (Supporting Information: Figure S3). The former allows us to observe the correlation between different characteristics of POs, while the latter shows how heterogeneous POs are within and between the three countries.
3 RESULTS
Stylized fact #1: Marginalized farmers are excluded
POs are frequently considered pro-poor institutions. Yet a recurrent hypothesis and finding is that the poorest households are often excluded. In this context and discussion, “exclusion” means “not being a member” and thus also refers to self-exclusion, for example, when participation is considered too costly or otherwise unattractive.
Most POs have an open membership, but there can be formal or quasi-requirements (e.g., being a member of the community or owning land) that de facto exclude certain households. Indeed, human, social, and physical capital are typically found to determine membership. For example, households headed by older, male, and more experienced heads with higher levels of formal education, and households with larger landholdings and ties with local authorities are often found to be more likely to be members. Similar to the poorest households, relatively wealthy households also tend to have a lower propensity to become members. This might be because they can access input, output, and credit markets without collective action.
Costs and benefits are naturally context-specific. Nevertheless, we largely confirm these case study results on correlates of participation with nationally representative data for several countries. For example, with these data, we can show that female-headed households are less likely to be members (Supporting Information: Table S14), adding external validity to previous evidence. We also show that not only the most marginalized households (e.g., those headed by women) but also the most marginalized members within households (such as women) are less likely to participate (Table 1). This finding has received little attention in the literature. Further, similar to previous results, we also find an inverted u-shaped relationship between land size and the propensity of participation (Table 1 and Supporting Information: Table S14), although the magnitude of these coefficients is rather small. Although our analysis confirms and adds external validity to findings from previous case studies, several unobserved factors (e.g., trust and risk aversion) are not captured but might affect farmers' willingness to join POs as well.
Table 1. Correlates of participation (linear probability model) at the individual level (CGAP).
| Y = individual is a member of a producer organization (0/1) | |
|---|---|
| Female household head (0/1) | −0.042*** |
| (0.009) | |
| Other female household members (0/1) | −0.026*** |
| (0.007) | |
| Age (years) | −0.001*** |
| (0.000) | |
| Any schooling (0/1) | 0.001 |
| (0.006) | |
| Land (ha) | 0.012*** |
| (0.001) | |
| Land (ha) squared | −0.000*** |
| (0.000) | |
| No. of household members | −0.001 |
| (0.001) | |
| Country dummies (base category = Bangladesh) | |
| Cote d'Ivoire (0/1) | 0.221*** |
| (0.010) | |
| Mozambique (0/1) | −0.057*** |
| (0.011) | |
| Nigeria (0/1) | 0.074*** |
| (0.010) | |
| Tanzania (0/1) | 0.003 |
| (0.010) | |
| Uganda (0/1) | −0.031*** |
| (0.010) | |
| Constant | 0.134*** |
| (0.013) | |
| Observations | 14,601 |
Note: Standard errors are shown in parentheses.
*** p < 0.01.
Less attention has been paid to the fact that not only the most marginalized households and household members but also the most marginalized communities and regions might be excluded. Anecdotal evidence suggests that POs are more likely to be set up in better-off areas that have market access (e.g., are located close to cities or roads), favorable agroecological conditions, and a certain level of institutional stability. Using LSMS community-level data, Supporting Information: Figure S1 shows the location of POs for the six sample countries. POs tend to be clustered in specific locations. This means that opportunities for households to become a member also vary regionally, even when holding household characteristics constant.
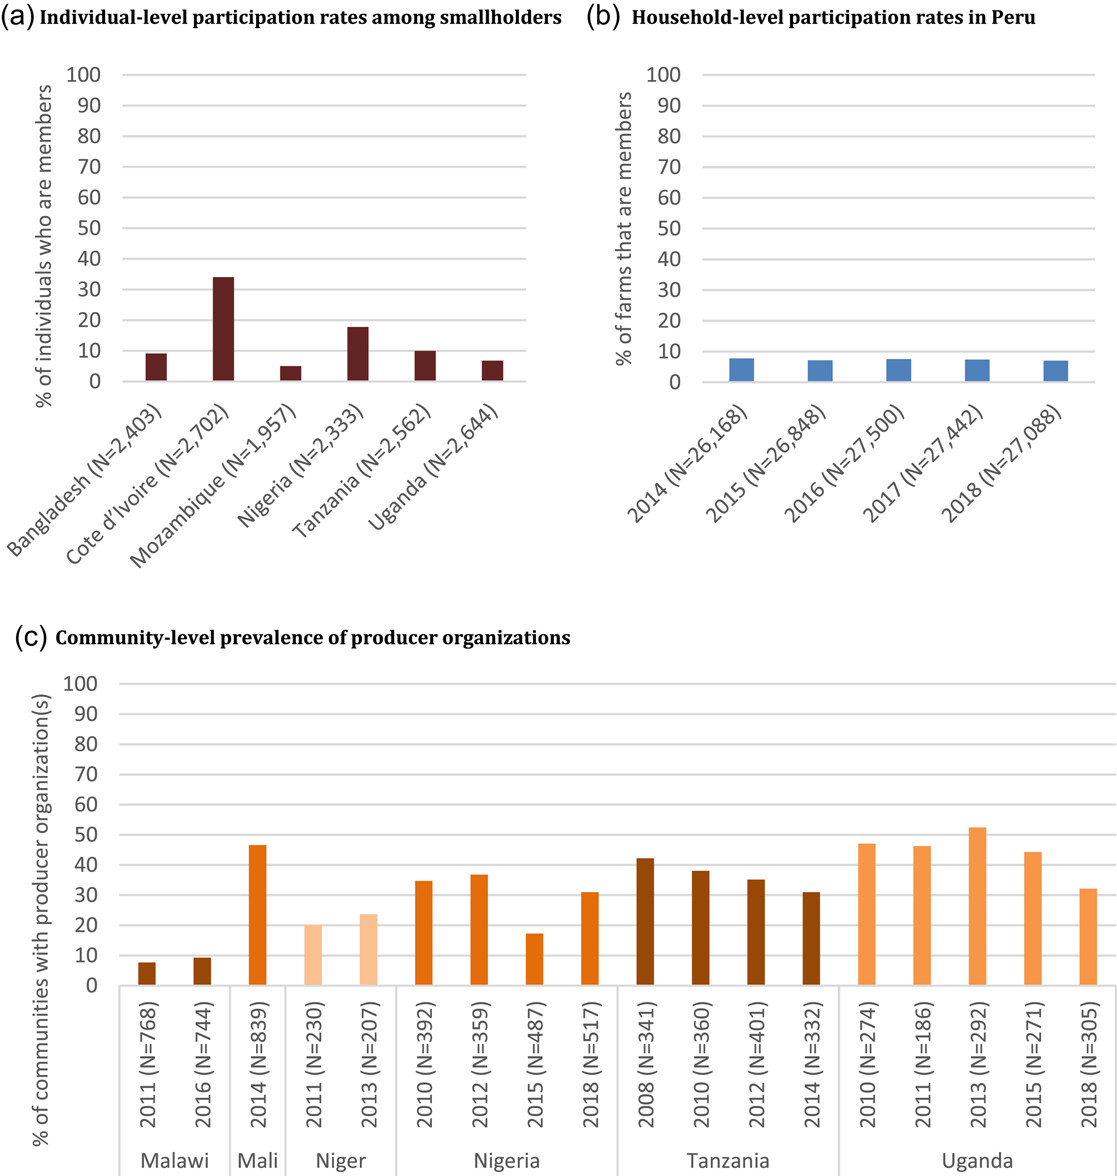
Another relevant question is what share of producers actually participates. Given the predominant sampling strategy (case studies, where members are oversampled), few studies can calculate participation rates. Figure 1 (and Supporting Information: Table S4) presents participation rates at the individual (GGAP data), household (Peru data), and community (LSMS data) levels and suggests that participation rates vary substantially across countries, but little over time—and that they are often relatively low, especially at the individual and household levels (panel a and b). In most countries, fewer than 40% of the sampled communities have at least one PO. Low participation rates are in line with figures reported elsewhere. Participation rates might vary by product, but case studies provide no indication for patterns that hold across countries.
Stylized fact #2: POs help mitigate policy and market failures by facilitating access to inputs, services, and markets
Smallholder farmers in lower-income countries often face barriers in accessing farm input, output, and credit markets, keeping them in a situation of semisubstance production and poverty. POs could mitigate these challenges by reducing transaction costs and exploiting economies of scale in production, marketing, and service provision. Various case studies suggest that this holds true.
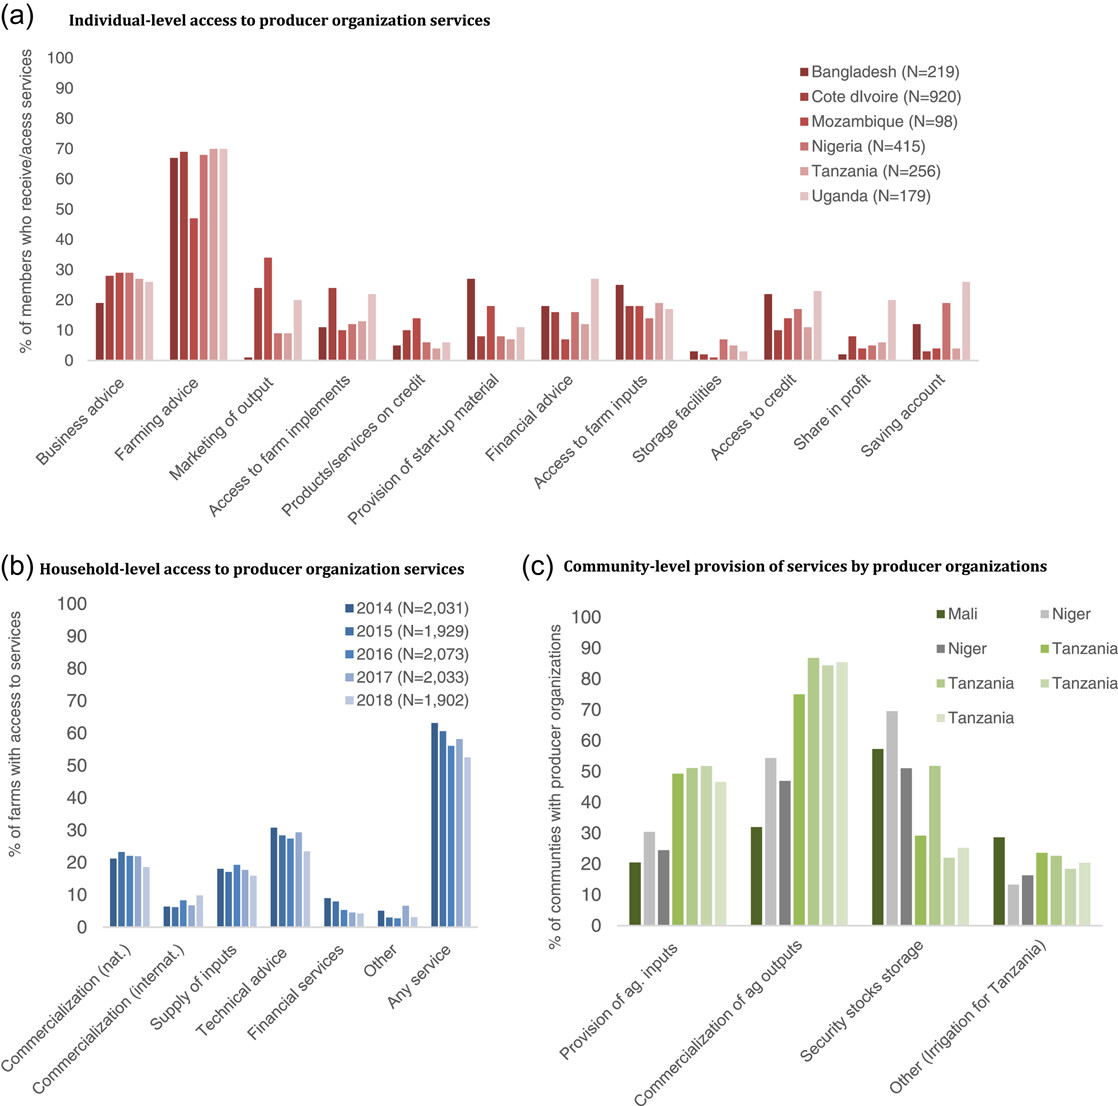
We use the compiled secondary data to further explore service provision by POs (see Figure 2 and Supporting Information: Tables S5–S7), which yields more generalizable information than case study evidence. As not all communities have POs, we conclude that POs can only help to address market and policy failures in certain regions, that is, in those that have POs (see Supporting Information: Figure S1). Figure 2 shows that a high share of members (panels a and b) receives agricultural extension and advice, whereas a smaller share receives inputs and financial services, somewhat contradicting the common, aforementioned narrative that POs provide a wide range of for example, agricultural and financial services. Similarly, most communities (panel c) that have a PO state that they fall behind in the provision of agricultural inputs. Yet we have no information on the quality of these services. Implicitly, Figure 2 also suggests that some members do not receive any services at all (panel b) suggesting heterogeneities in service provision across POs, as also highlighted in some previous studies (see also stylized fact #4).
Stylized fact #3: Members benefit
A large number of studies focus on income effects of POs, and most of them find that members have, on average, higher farm and overall household incomes than comparable households who are not members. We can confirm these case study findings with nationally representative data from Peru (Table 2) which suggest a significant and economically relevant difference between members and nonmembers. As we discuss further below, causal identification is a big challenge in this literature, given that most studies rely on cross-sectional data. Our regression analyses are similar to the methodological approaches that are often found in this body of literature, as we do not address omitted variable bias at the household level. However, our approach improves on the existing literature in a number of ways. For example, using nationally representative panel data, we can use year fixed effects and administrative-level fixed effects to consider nonobservable heterogeneity at different geographical units. Nonetheless, given that we cannot control for time-varying unobserved heterogeneity, we caution the reader not to interpret our results as causal.
Table 2. Farm income and PO membership (Peru) (linear regression).
| Y = farm income (log) | (1) | (2) | (3) |
|---|---|---|---|
| Member of PO (0/1) | 1.132*** | 0.525*** | 0.744*** |
| (0.092) | (0.091) | (0.091) | |
| Women operator (1/0) | −1.470*** | −1.161*** | −1.044*** |
| (0.054) | (0.052) | (0.051) | |
| Age of the operator (years) | 0.011*** | 0.014*** | 0.015*** |
| (0.002) | (0.002) | (0.002) | |
| Operator completed primary school (0/1) | 0.567*** | 0.456*** | 0.379*** |
| (0.054) | (0.053) | (0.053) | |
| Total land (ha) | 0.003*** | 0.002** | 0.008*** |
| (0.001) | (0.001) | (0.001) | |
| Total land (ha) squared | −0.000*** | −0.000* | −0.000*** |
| (0.000) | (0.000) | (0.000) | |
| Indigenous (0/1) | −0.944*** | −0.485*** | −0.293*** |
| (0.067) | (0.070) | (0.072) | |
| Constant | 4.000*** | −0.855*** | −0.103 |
| (0.157) | (0.321) | (0.552) | |
| Observations | 107,236 | 107,236 | 107,236 |
Note: Standard errors are shown in parentheses. All regressions include year fixed effects and administrative-level fixed effects (department-fixed effects in column 1, province-fixed effects in Column 2, and district-fixed effects in column 3). POs include cooperatives, associations, and committees.
* p < 0.1
** p < 0.05
*** p < 0.01.
Theoretically, better access to services (see above) could indeed improve incomes. Relatedly, in the literature, membership was found to be correlated with increased adoption of technology, inputs, and production practices, improved natural resource management, higher productivity, and a higher level of commercialization.
Overall income is also a function of output prices. Interestingly, prices offered by POs are not always higher than those offered by other buyers, although some studies suggest that POs usually offer more stable prices over time so that membership can serve as a risk reduction strategy. As prices offered by POs and on regular markets (e.g., by middlemen) do not always differ, it is not uncommon for members to sell parts or all of their production to other buyers. Another reason why members might sell to buyers other than their PO is that POs are often not able to pay immediately upon delivery. Limited output quantities and/or uncertainty can yield problems for POs to meet contracts or maintain financial liquidity (see also stylized fact #4).
Another discussion in the PO literature is whether some might benefit more from membership than others. For example, there is disagreement about whether large farms or small farms benefit more. Other household characteristics, the type of product, and the availability of infrastructure might also matter for outcomes.
Stylized fact #4: Organizational characteristics differ and matter
Until now, we have mainly focused on average differences and general patterns, disregarding the diverse subgroups and legal forms of POs (e.g., cooperatives, extension groups, natural resource user groups, associations, etc.) and so does the extant literature. However, here we highlight the diversity in key organizational characteristics, as it is easily overlooked, difficult to capture, and important. Our case study data from Cote d'Ivoire, Ethiopia, and Kenya underline this diversity, showing that heterogeneity is large across and even within broader categories and countries (see Supporting Information: Tables S8–S12 and Figures S2–S3 for details). The data presented here come from studies that had different purposes and thus used different survey instruments. Therefore, to choose the PO characteristics on which we focus, we compared the three questionnaires and selected all the variables for which there was an overlap.
In what follows, we focus on organizational characteristics that are both decisive and heterogenous across organizations, namely leadership and governance, members' commitment, and financial resources. These characteristics can affect the quantity and quality of services provided, the type of members that organizations attract, whether members benefit, and whether benefits are captured by powerful groups.
First, POs' success critically depends on their governance and leadership (i.e., leaders' characteristics, commitment, and skills), the degree to which members trust their leaders, and the organizations' institutions to ensure accountability and transparency. If poor or absent, they can importantly limit the organizations' competitiveness, ability to attract and maintain a sufficiently large number of members, and options to limit elite capture.
Second, the degree to which members commit to the PO in terms of participating in group activities, meetings, and decision-making varies substantially across organizations. Free-riding and collective action problems are common because participatory approaches can incur substantial costs (e.g., time investment) for members, which can be far higher than (often low) membership fees. Also, POs that focus on marketing output have to rely on that members will indeed sell a sufficient amount of output to them, so they can fulfill contracts with buyers and finance possible investments. Yet as discussed above, members often sell substantial shares of their output to other buyers.
Third, POs are also diverse in terms of their financial resources. Many POs lack financial resources or depend heavily on external support, limiting their economic sustainability. Economic success depends on many factors, such as their size. POs with few members can often not reach economies of scale (e.g., generating and marketing a sufficient quantity output to generate funds that can be reinvested). In turn, very large POs face high organizational costs and difficulties to serve their often very diverse members. Relatedly, POs that are inclusive and open (loose entry requirements and low membership fees) often do not generate great benefits for their members. In other words, there is a tradeoff between efficiency (performance-oriented goals) versus equity (inclusiveness).
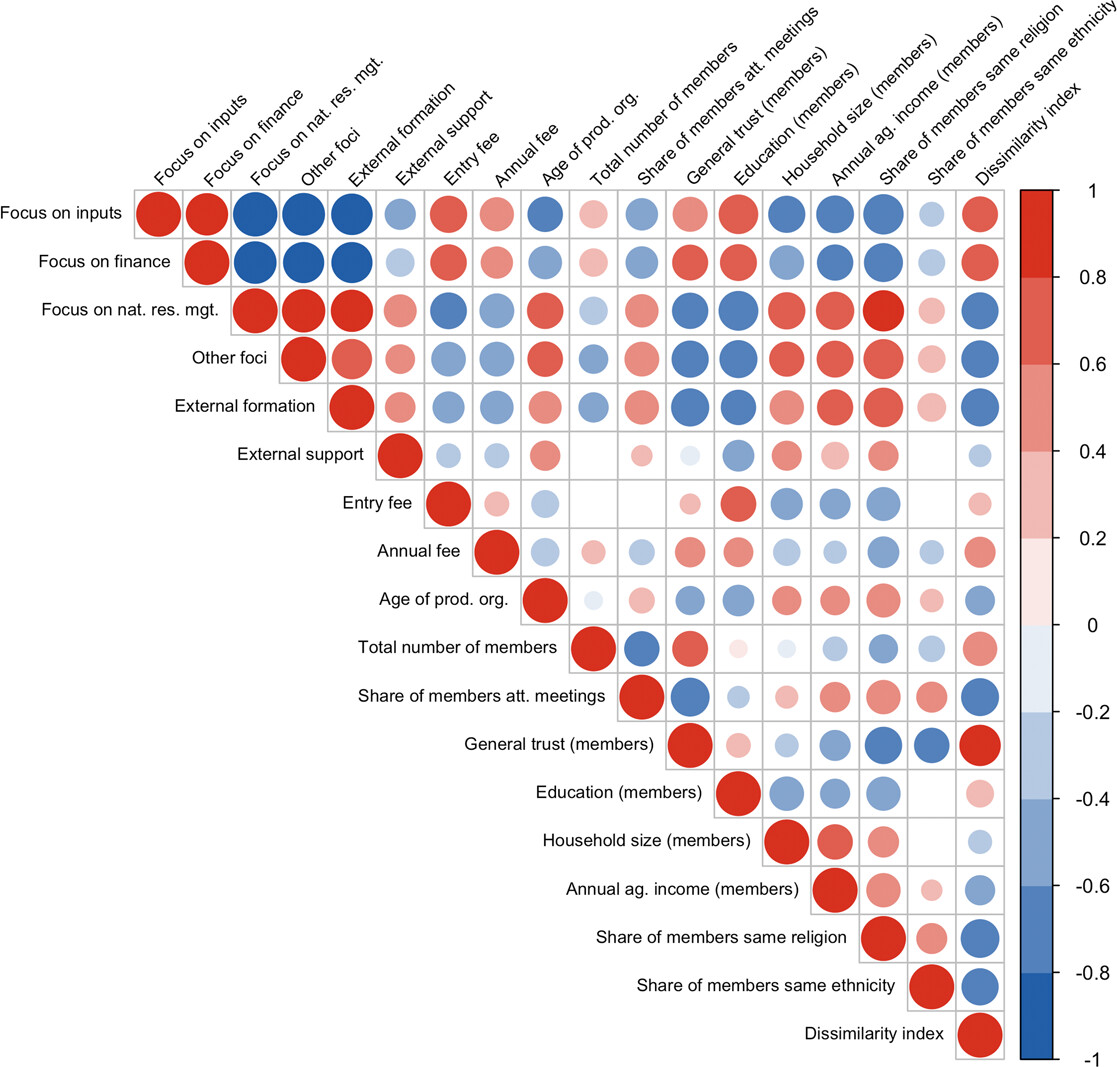
Using our primary data, we examine how different organizational and member characteristics are correlated (Figure 3 and Supporting Information: Figures S2–S3), thereby confirming some of the aforementioned (often anecdotal) findings. For example, POs that receive external support (particularly during their establishment) tend to have more homogeneous members (same religion and ethnic group), and a larger share of their members attend group meetings (Figure 3). Further, estimated correlation coefficients in Supporting Information: Table S13 suggest that POs with external support and entry barriers (i.e., fees) are more likely to benefit their members, which reinforces the tradeoff between efficiency and equity.
Stylized fact #5: POs benefit communities at large
Anecdotal evidence suggests that POs do not only benefit their members but also have positive spillover effects on nonmembers who live in the same communities. Nonmembers might benefit indirectly because many of the services provided to members are nonexcludable (i.e., difficult or costly to exclude nonmembers), such as market information or technical agricultural advice. Some POs also make investments in public goods, such as community infrastructure (e.g., improvements in roads and construction of wells in villages), which could benefit non-members. Similarly, in some cases, POs buy from both members and nonmembers, so that nonmembers can benefit from collective marketing. Furthermore, POs were also found to affect prices on regular markets (e.g., prices offered by middlemen), meaning that nonmembers can be affected even when they do not sell to POs.
Certain services are, however, excludable and costly to provide to nonmembers. This often holds, for example, for credits or subsidized inputs. Thus, we might assume that POs increase their members' welfare more than that of nonmembers, potentially leading to more economic and social inequality, especially in contexts where the worse-off farmers face entry barriers. Despite the claims and anecdotal evidence that POs benefit communities at large, the majority of studies do not test this hypothesis empirically. More evidence on spillover effects will be needed to make generalizable conclusions.
4 DISCUSSION AND IMPLICATIONS FOR RESEARCH AND POLICY
Stylized fact #1 is that marginalized households are often excluded. We confirm this finding and show that participation rates at the individual, household, and community levels are low, with great variation within and across countries. Given the limited and geographically biased reach, governments and development actors should carefully consider who can—and who cannot—be reached, for example, when distributing inputs and services via POs. Relatedly, setting up and supporting POs can be costly and funds channeled to POs cannot be spent on public services that POs are eventually supposed to deliver. Additionally, support tends to be most efficient when channeled to already higher-performing POs, and the level of support that is just enough to substantially improve performance can be difficult to determine. Participation patterns and dynamics at community and regional levels (as opposed to household level) are not well understood but are important in this regard. Future research could focus on the determinants of PO density, for example, the effect of infrastructure projects or institutional reforms. Data featured in this paper, matched with additional data, could be used for this purpose.
Stylized fact #2 suggests that POs provide a wide range of services, thereby mitigating market and policy failures. However, our data partly contradicts this claim. While we confirm that POs help address some market failures by providing services to their members, asking how “wide” the range of services is, on average, leads to more conservative statements. The type and quality of services provided vary substantially across organizations and contexts (see stylized fact #4). Similarly, not all services are appreciated equally by members (e.g., farmers tend to prefer that POs use their resources to provide services to them individually, as opposed to offering services with public goods characteristics). Furthermore, our data show that POs have limited capacity to address farmers' financial constraints, either by facilitating access to inputs or credit. Less than 20% of all members have access to the former, while less than 10% have access to the latter (Figure 2b). Since access to credit is often mentioned as one of the main hurdles faced by smallholder farmers, governments and development agencies could develop tailored programs to help solve this market failure through POs. Thus, the degree to which POs contribute, on average, to mitigate market and policy failures might be overemphasized in the current discourse. And severe policy failures (e.g., lack of investment in infrastructure) will make it almost impossible for POs to address even smaller problems (e.g., establishing market linkages with large buyers).
Stylized fact #3 is that members of POs obtain higher yields, commercialize a large share of their output, and have higher incomes, while better managing natural resources. Using nationally representative data from Peru, our results confirm a positive correlation between income and group membership. However, establishing causal relations remains challenging. The literature that seeks to explore effects of membership largely lacks internal and external validity, underlining noticeable similarities with the related bodies of literature on contract farming and certification. In particular, most studies are based on cross-sectional observational data and use relatively simple statistical methods (especially propensity score matching [PSM]) to compare members and nonmembers. Thus, results cannot be interpreted as causal. Randomized controlled trials (RCTs) and secondary data (especially large, nationally representative panel data sets like the ones used in this paper) could help improve internal and external validity, respectively. Relatedly, any of the two aforementioned approaches would reduce concerns about publication bias. RCTs are, however, difficult to implement in this context (e.g., randomizing membership can be infeasible in practice).
Stylized fact #4 emphasizes that POs are diverse. While we corroborate this claim, showing that POs can be highly heterogeneous within and between countries, we also emphasize that such diversity is often overlooked and difficult to capture with common approaches. Large secondary data sets typically lack information on organizational characteristics. So far, few primary-data-based studies sampled more than one or a handful of POs. While our primary data—with a large number of POs and detailed information on their organizational characteristics—provide interesting correlations, it is difficult to disentangle the effect of these characteristics. How POs are organized, who their members are, what kind of partnerships they have with third-party actors, and what type of services they provide can change over time. For example, younger POs tend to use their revenue to invest in their own operations (e.g., building storage centers, and buying vehicles and computers), while older POs are more likely to invest in public goods. This suggests that the benefits that farmers and other members of rural communities derive from POs will change over time. However, such dynamism is ignored by the literature, as we could not identify any study that uses data from multiple time periods to explore the effects of different PO characteristics. Future studies, using larger sample sizes or behavioral experiments, will be needed to improve our understanding of organizational diversity and the importance of different organizational characteristics for different outcomes among members. Such insights would be relevant for policy and development projects.
5 CONCLUDING REMARKS
This paper provides a narrative summary of common findings in the literature on POs in the form of five stylized facts. Additionally, we use unique and diverse cross-country primary and secondary data at the individual, household, and cooperative levels to test, add new insights to, and challenge these five stylized facts. We also highlight directions for future research, which could address research gaps and limitations of our analysis. For this purpose, data featured in this paper could be used or serve as a starting point.
The large body of literature on POs shows that members of well-functioning POs typically benefit—in multiple ways. Yet in many lower-income countries, few farmers are members of POs, and even fewer are members of well-functioning ones. The diversity of organizations and their characteristics, low participation rates, and the geographical distribution of POs should receive greater attention in future discussions and research. Additionally, limited internal and external validity are key shortcoming of this body of literature that future work should address.
ACKNOWLEDGMENTS
Primary data collection in Cote d'Ivoire, Ethiopia, and Kenya was financially supported by the German Research Foundation (DFG) (RTG 1666), the Danish Council for Independent Research (DFF 6109-00296), and the German Federal Ministry of Food and Agriculture (BMEL) (2813FSNu01), respectively. Additional financial support was received from the BMEL (2219NR144) during the writing of this paper. We thank seminar participants at Copenhagen, Bonn, Reading, and OARES for useful comments.
CONFLICT OF INTEREST STATEMENT
The authors declare no conflict of interest.
Published under a CC BY 4.0 license.

Add new comment